 Dicaria
France's economy in numbers: from above the EU average to the middle
The question is not whether France's economy grew. It did, in cash terms. The question is where it stands against the rest of Europe, and when that changed.
In 2014, a person in France produced 8% more real output than the average EU resident. By 2025 that lead was gone: France sat at 98, two points below the EU average of 100, while Germany fell from 128 to 115 and Italy stayed at 96–98. In cash terms France grew: output per person rose from €32,620 to €43,350 at current prices, +33% in eleven years, while the EU rose 56%. France was not shrinking — it was growing more slowly than the average, and the lead above the EU average was gone by 2022. The change is relative, not absolute. Measured against the rest of Europe, France moved from the top of the middle group to its middle.
Why these comparisons
We compare France with Germany and Italy because they are the other two large economies in the euro area and the ones most often set against it. Germany is the strongest of the three on the real index. Italy is the weakest. France sits between them, which makes it the useful middle case.
The EU27 average is the yardstick because it is the one number every country in the table is measured against. An index equal to 100 means "the EU average that year". A country above 100 is ahead of the average; below 100 it is behind.
Two ways to measure the same economy
Eurostat publishes output per person in two forms. One is in current euros. It moves with prices and exchange conditions. The other is an index of real output, scaled so the EU average equals 100. It strips out prices and makes countries comparable with each other.
We use both, because they answer different questions:
- Current euros answer "how much does a typical person in this country produce, in money?"
- The real index answers "is this country pulling ahead of or falling behind the EU average?"
The first one flatters everyone in a period of inflation. The second one is the one that shows relative position.
Cash income: everyone rose, France less than most
| Year | France | Germany | Italy | EU27 |
|---|---|---|---|---|
| 2014 | €32,620 | €37,010 | €27,070 | €26,850 |
| 2019 | €36,090 | €43,280 | €30,140 | €31,740 |
| 2020 | €34,230 | €42,350 | €28,030 | €30,560 |
| 2022 | €38,870 | €48,600 | €33,860 | €36,190 |
| 2023 | €41,340 | €51,090 | €36,310 | €38,470 |
| 2025 | €43,350 | €54,240 | €38,430 | €41,770 |
From 2014 to 2025, France rose +33%, Germany +47%, Italy +42%, and the EU +56%. France grew the least of the four.
Put another way, France's cash growth ran at about 85% of the EU's pace (its growth ratio divided by the EU's). Germany ran at about 94% and Italy at about 91%. These are derived from the table above, not separate Eurostat series.
Eurostat marks France's 2024 and 2025 figures, and Germany's and Italy's 2025 figures, as provisional; revisions are normal in that window, so treat the last two years as a first estimate, not a settled figure.
The real index: where the gap closed
The real index shows the relative position most clearly.
| Year | France | Germany | Italy | EU27 |
|---|---|---|---|---|
| 2014 | 108 | 128 | 98 | 100 |
| 2019 | 105 | 123 | 96 | 100 |
| 2020 | 103 | 124 | 93 | 100 |
| 2021 | 101 | 122 | 96 | 100 |
| 2022 | 97 | 120 | 98 | 100 |
| 2023 | 99 | 118 | 98 | 100 |
| 2024 | 98 | 116 | 98 | 100 |
| 2025 | 98 | 115 | 96 | 100 |
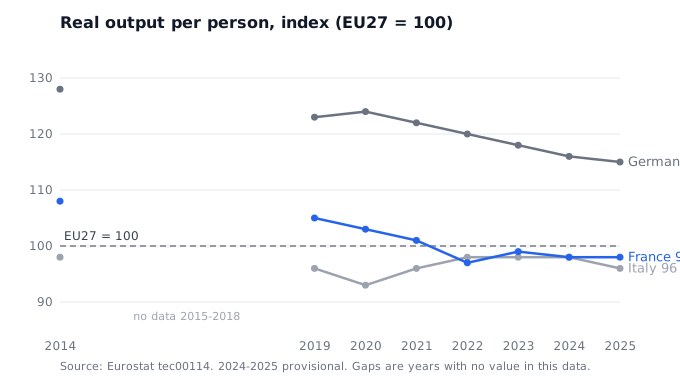
Three things stand out.
France started the decade eight points above the EU, second of the three. Germany was at 128 in 2014, far ahead. France's lead did not last. It was still above the average in 2021 (101), fell below it in 2022 (97), and has stayed at or just under 100 since.
Germany is still the highest of the three, but it has been falling too. It went from 128 to 115. Its lead over France did not close: the gap stayed between 17 and 23 points for the whole decade. What moved was the EU average's position relative to both, not France catching Germany.
Italy barely moved. It sat between 93 and 98 for eleven years. It started just below the EU average, and in 2022 overtook France on the index. Since 2024 the two have been level within two points.
What the change looks like year by year
The biggest single move for France is the drop between 2019 and 2022. France fell 8 index points in three years, from 105 to 97. Germany fell 3 points over the same period, from 123 to 120, and still sits 15 points above the EU average in 2025. Italy rose 2 points over the same period, from 96 to 98.
The pandemic year accounts for part of this. Output per person fell in 2020 in every country in the table. France's cash-terms output had not regained its 2019 level in 2020, and the real index never got back to its 2019 position of 105 in the years shown. From 2021 onward, France's real index sat between 97 and 101, below its 2019 level. The relative position did not come back.
The gap to Germany is the clearest sign of this. In 2019 France was 18 points behind Germany. In 2025 it was 17 behind. The distance barely changed. France's movement was against the EU average, and against Italy, not against Germany.
Three readings, and which one the data supports
People describe this decline in different ways. Three readings are common. The data supports one and not the others.
- "France is in decline." Not supported. In cash terms output per person is higher in 2025 than in 2014, and the only fall in the years we pulled is 2020. A decline in relative position is not a decline in output.
- "France has fallen behind its neighbours." Partly supported. France fell behind the EU average and Italy. It did not fall behind Germany in relative terms, because Germany fell too.
- "France lost its lead." Supported. France was above the EU average in 2014 and was level or below from 2022. That is the only reading this table makes certain.
The first reading confuses a level with a trend. The second reading uses the wrong reference. The third is the one the numbers make certain.
What would change this conclusion
A relative index can move for reasons that have nothing to do with French output. Three things would make this reading wrong:
- If the 2024 and 2025 figures are revised. The provisional values are the two most recent years. A material revision would move the end point, and the conclusion with it.
- If the EU27 aggregate changes. The index is relative to the EU27 average. Membership changes, or a large revision to another member, would move the yardstick.
- If population is shrinking faster than output. Per-person figures can rise while total output falls, or the reverse. This table has no population series that we have verified, so it cannot separate those cases.
What the numbers do not say
- Why. This table has no policy, labour, investment or demographic variables. It records the outcome, not the cause. Any explanation you read is an interpretation, not something these numbers show.
- That France declined. Real output per person fell 10 index points relative to the EU, and it was still growing in cash terms. The story is relative position, not recession.
- That France is poorer than Germany in total. These are per-person figures. Total output and population are different measures.
- That 2020 is a trend. The 2020 dip is the pandemic year and moves every country. It is a shock, not a turning point.
FAQ
Is France in recession?
Why use an index instead of growth rates?
Why does the real index show France falling behind Germany but not Italy?
- Source: Eurostat national accounts, tables tec00001 (GDP per capita in current euros) and tec00114 (real GDP per capita index, EU27 = 100), accessed 2026-11-03.
- Countries: France (FR), Germany (DE), Italy (IT), EU27 (EU27_2020). Years 2014–2025.
- Provisional values (p) and the 2020 break (b) are kept as Eurostat marks them.
- Derived figures (growth ratios, gaps between countries) are calculated from the table values, not separate Eurostat series.
- Limits: per-person measures, not totals; no population or inequality split; the index is relative to the EU27 average, not an absolute level.
Sign-up comes with a key and an MCP config: ask your AI agent for any EU country's national accounts by year and unit, alongside company records in the same chat.
2,000 free reads included at sign-up; searches and misses are not counted.
Also in this series: who runs France's biggest brands, per the company register