 Dicaria
The list that says 'stop debating CVSS': 1,768 entries, and a V-shape
CISA's Known Exploited Vulnerabilities catalog is the one CVE list that counts evidence instead of risk scores. Its five-year shape — a backfill, a peak, a half-drop, and a rise — tells you more about how vulnerabilities get attention than any severity ranking.
As of catalog version 2026.11.04, CISA's KEV lists 1,768 CVEs with confirmed exploitation in the wild. The yearly additions trace a V: a 291-entry backfill opened the catalog in November 2021; additions peaked at 555 in 2022, halved to 187 in 2023, held at 186 in 2024, rose to 245 in 2025, and 2026 has 284 entries in ten months (an annualized pace near 340, derived). 361 entries (20.4%) carry the flag "known ransomware campaign use."
What the catalog is, and what it is not
The KEV (Known Exploited Vulnerabilities) catalog is the list on which CISA has evidence of real-world exploitation, not a model's opinion about potential harm. Since 2021 U.S. federal agencies must remediate its entries on deadlines the catalog itself publishes (every row has a due_date). That makes it the closest thing to an agreed CVE priority tier: CVSS scores what a bug could do; KEV records what it did.
Two boundaries before the numbers. First, KEV is not a severity ranking — a 6.5-scored command injection that criminals actually use outranks a theoretical 9.8, and the file shows that: command injection (CWE-78) is the second most common weakness class among the 1,768. Second, the catalog is a triage of known CVEs, not a discovery log: CVE-2017-0144 (EternalBlue, the WannaCry exploit) was added in February 2022 — five years after its ID was minted. A CVE can sit unlisted while it circulates in exploit kits, then enter the catalog when triage catches up. The yearly curve therefore measures CISA's attention cycle as much as criminals' activity: the evidence is real, but evidence reaches paperwork on a delay.
The opening batch explains the first spike
The catalog's oldest entry is dated 2021-11-03, and 291 of the 311 entries tagged 2021 were added in that first month. The catalog began as a bulk load: known active exploitation compiled into a federal deadline list.
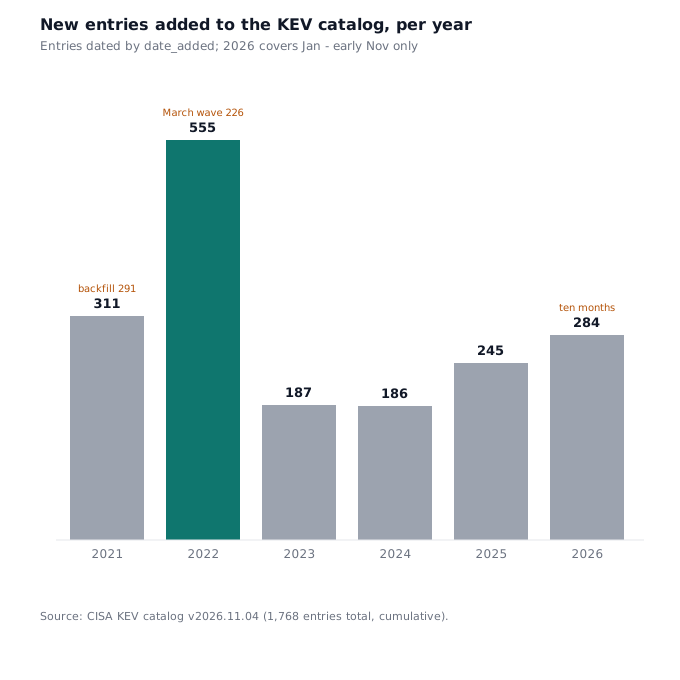
That matters for reading the rest of the curve. The 2022 "peak" of 555 has its own second backfill inside it: 226 entries landed in March 2022 alone — more than four times a steady-state month. Excluding that month, 2022 still tops the series at 329, so the peak year is real, but its size is partly administrative history: the early 2020s were when ransomware-on-critical-infrastructure moved from incident blogs into federal catalogs (ProxyShell, Follina, Atlassian Confluence, Exchange, each visible in the vendor column).
Why did additions halve in 2023-2024?
2023 (187) and 2024 (186) run at a third of the 2022 headline. Two readings are possible from this file alone, and the honest article states both: exploitation slowed, or the backlog effect faded after the first triage pushes emptied. What 2023–24 rows do show: steady-state months of 15–45 additions, no bulk load at the 2021 or 2022 scale, and a rotating vendor mix — Ivanti and Fortinet appliances climb the vendor column in exactly these years where Exchange led 2021–22. The quiet is in the process, not in the target set.
The 2025 rise (245, +32% over 2024) and 2026 pace (284 by early November) argue that quiet years were not quiet exploitation. The direction after 2024 is up, and if 2026 holds shape, it lands near 340 — above 2023 and 2024 combined, below 2022 even with its March wave.
One flag changed what "exploited" means
In November 2022 CISA began marking entries "Known Ransomware Use: Known." Today 361 of 1,768 (20.4%) carry it — the intersection where exploitation meets the most expensive category of incident. (When the flag started, exact-date granularity isn't in this dataset; the count is.)
The vendor mix around the flag is where this file gets interesting. Of Microsoft's 390 entries, 117 (30.0%) are ransomware-flagged — versus 17.7% for every other project combined. Whatever else the pattern reflects, Microsoft's stack (Exchange, Windows, the old SMB/EternalBlue-era entries) is where ransomware campaigns historically found their front doors. Cisco (102), Apple (96), Adobe (83), Google (76) follow in raw count.
One caution the file forces: newer entries rarely carry the ransomware flag — 27 of 284 in 2026 (9.5%), most below the ~20% all-time rate. Attribution of a campaign lags entry. The 2026 numbers understate ransomware use by construction; that is a timing artifact, not a decline. The vendor split is one query — pull the catalog fresh and recount it; new entries land weekly and next month's mix is yours to derive.
What about the 52 entries with no patch?
required_action in the catalog is almost all boilerplate: "apply updates per vendor instructions" (893) or "apply mitigations" (744 combined). But 52 entries say the impacted product is end-of-life — CISA's own wording for there is no patch; mitigation is your problem. That tail is the catalog's hardest operational signal, and it is invisible in any CVSS ranking.
What this data cannot answer
- When a CVE was actually first exploited. Only the date added to KEV; the catalog is a federal paperwork artifact, not a forensic log.
- Which campaign or actor. Beyond the binary ransomware flag, no attribution fields.
- Remediation outcomes. Due dates exist; whether agencies met them does not.
- Vulnerability rate per vendor. No denominator of products shipped or CVEs published, so vendor counts are exposure shares, not quality scores.
Frequently asked questions
What is the CISA KEV catalog?
How many known-exploited vulnerabilities are used by ransomware?
Is the KEV catalog growing?
Does KEV replace CVSS scores?
- Data pull: 2026-11-06 (agentdata SDK).
- Source: CISA KEV catalog v2026.11.04 (released 2026-11-04), retrieved via the agentdata SDK on 2026-11-06. Full pull: 1,768 entries; the result's count_total matched rows returned (no truncation).
- Fields used: date_added, vendor_project, known_ransomware_campaign_use, required_action, cwes, due_date. Yearly/monthly counts derived from date_added.
- The two backfill months (2021-11: 291; 2022-03: 226) are separated in the trend reading rather than smoothed away.
- Ransomware-flag counts are the catalog's own binary marking. Attribution lag for 2026 entries is stated in the body.
- Vendor shares are exposure shares, not defect rates (no product-count denominator exists in the file).
Each yearly bar, the 20.4% ransomware share, the Microsoft split — all one query against the same file this article was written from. Sign up free to get a key and an MCP config, then ask your AI agent to pull the catalog fresh: new entries land weekly, so next month's V-shape is yours to re-derive.
A free allowance is included at sign-up. Registering keeps every pull timestamped and repeatable.