 Dicaria
The EU food rejection league table is wrong: rate, not count
By raw counts, Türkiye tops the EU's food border-rejection table and China sits mid-pack. Divide by export value and the table flips: Argentina and India lead, Türkiye is only third, and China falls near the bottom.
In RASFF notifications validated September 17 – November 9, 2026, Türkiye leads border rejections with 49, Brazil 27, India 23, China 14 — but that ordering mostly measures who ships the most food to Europe. Per $1B of exports the table flips: Argentina 48.7, India 24.1, Türkiye 19.8, Brazil 7.0, China 6.8, US 3.1. China falls from a top-5 concern to near the bottom. Each origin has a signature: Türkiye ochratoxin A in figs, Brazil Salmonella in poultry, the US and Argentina aflatoxins in nuts.
Two tables, one dataset — and the difference is the denominator
The EU's Rapid Alert System for Food and Feed (RASFF) logs every rejected shipment at the border. The 800 notifications validated September 17 – November 9, 2026 include 221 border rejections — shipments refused at entry, never reaching a European shelf.
Count them by origin and you get the table that gets quoted:
| Rank | Origin | Rejections |
|---|---|---|
| 1 | Türkiye | 49 |
| 2 | Brazil | 27 |
| 3 | India | 23 |
| 4 | Russia | 15 |
| 5 | China | 14 |
| 6 | Vietnam | 10 |
| 7 | United States | 7 |
| 8 | Argentina | 6 |
The rejections spread evenly across the window (September 67, October 121, November 33; window Sep 17 – Nov 9) — no single month drives the table. It is real, and it is misleading: it mostly measures who sells Europe the most food. Export twice the volume, get twice the inspection opportunities; rejection counts rise even if every batch is exactly as likely to fail.
The honest version divides the count by the trade. Join the same 221 rejections to UN Comtrade food-export values (seven food HS chapters, exports into Germany and the Netherlands — the EU's two dominant entry points — latest complete year, 2024) and the table rearranges:
The rate table: rejections per $1B of food exports
| Rank | Origin | Rejections | Exports to DE+NL ($B) | Rate |
|---|---|---|---|---|
| 1 | Argentina | 6 | 0.12 | 48.7 |
| 2 | India | 23 | 0.96 | 24.1 |
| 3 | Türkiye | 49 | 2.48 | 19.8 |
| 4 | Brazil | 27 | 3.88 | 7.0 |
| 5 | China | 14 | 2.07 | 6.8 |
| 6 | United States | 7 | 2.22 | 3.1 |
Russia and Vietnam from the count table are absent here — sanctions broke Russia's denominator, Vietnam's reporter data is missing from Comtrade 2024. Data-driven exclusions, detailed in the data notes below.
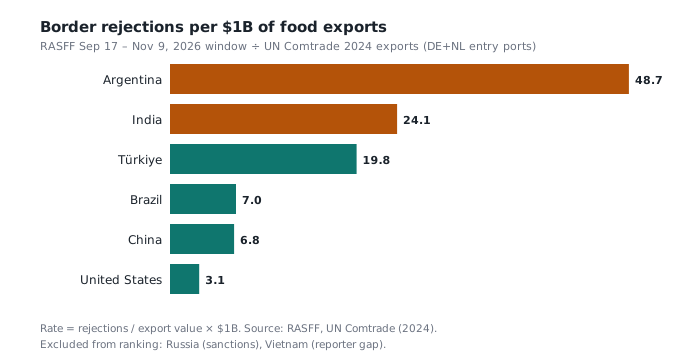
Three things the rate table shows that the count table hides:
Argentina is the outlier. Six rejections — eighth place, invisible in any headline. But Argentina ships only $0.12B of food through these two ports, so its rate is 48.7 per billion — more than double India's, 2.5 times Türkiye's, nearly sixteen times the US'. Small exporter, concentrated problem.
Türkiye drops from first to third. Forty-nine rejections sit on a large trade ($2.48B). At 19.8 per billion it is still well above Brazil, China or the US — the count table exaggerated, but did not invent. "Türkiye is Europe's food problem" survives only as a rate story about one commodity.
China falls, and the fall is the point. Fifth by count; fifth-lowest by rate (6.8, just above the US). The gap between the tables is the distance between "China is a top-5 food-safety concern for EU imports" — which the count table implies — and "China's rejection rate is in the same band as Brazil's and below India's" — which the joined data shows. Volume, not failure rate, put China high on the count table. To build the same table for another origin, rerun the join yourself — the counts and the denominators are two queries.
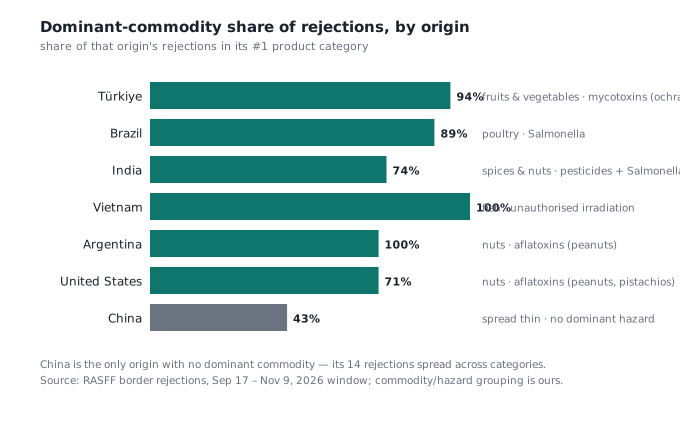
Every origin has a signature
Grouped by product category and hazard, each origin has a characteristic profile:| Origin | Dominant category | Dominant hazard | | --- | --- | --- | | Türkiye | Fruits & vegetables (46 of 49) | Mycotoxins (37 — mostly ochratoxin A in dried figs) | | Brazil | Poultry meat (24 of 27) | Salmonella (23) | | India | Spices/herbs (12) + nuts (5) | Pesticides + Salmonella, both | | China | Spread across cereals, cocoa/tea, others | No dominant hazard | | Vietnam | Fish (10 of 10) | Unauthorised irradiation | | United States | Nuts (5 of 7) | Aflatoxins (peanuts, pistachios) | | Argentina | Nuts (6 of 6) | Aflatoxins (peanuts) |
Türkiye's problem is mostly one thing: ochratoxin A in dried figs — 37 of 49 rejections are mycotoxins, the large majority on one commodity. Brazil's is one bacterium in one commodity — 23 of 27 are Salmonella in poultry. The US and Argentina fail on the same mould mechanism in nuts — aflatoxins in peanuts and pistachios. Vietnam's file is one commodity, one violation: unauthorised irradiation.
China's signature is the odd one: diffuse. No dominant commodity, no dominant hazard — fourteen rejections spread across categories: unauthorised GMO events in rice cakes (3), cetrimonium chloride in tea (3), food-contact materials — formaldehyde migration from melamine tableware, missing documents — (2), pesticide above limit in dried orange peel (1), THC above limit in nuts (1), missing official-control certificates on cocoa (1), and miscellany. Each is its own violation type. A concentrated signature (Brazil's Salmonella, Türkiye's ochratoxin) points at a specific supply chain that can be fixed specifically. A diffuse one reads as many small, unrelated findings — a different problem, and a smaller one per billion shipped.
What the two tables agree on
The rate table does not rescue Türkiye — it convicts it more precisely. At 19.8 per billion it remains well above every large exporter, and its signature is tight: one hazard class (mycotoxins), one commodity family (dried fruit). Regulating Turkish dried produce addresses about a fifth of all border rejections; all fresh produce, a third.
Nor does the rate table excuse Brazil's volume: 7.0 per billion on a $3.9B trade is 27 rejections, 23 the same bacterium — a rate story and a count story at once.
The United States, at 3.1 per billion on $2.2B of trade, is the cleanest large exporter here — though 5 of its 7 rejections are aflatoxins in peanuts, so clean is the rate, not zero risk.
This comparison cannot say
- "Country X food is dangerous." Border rejections measure findings on traded batches passing inspection — not national food safety, and not what citizens eat.
- "Türkiye's rate rose because of 2026." The denominator is the latest complete trade year (2024); the window is Sep 17 – Nov 9, 2026. A sharp trade shift in between could move the ordering.
- "Russia's food is safe" from its absence — sanctions broke its denominator; it earns no rate.
- "Rate equals risk per meal." The denominator is export value, weighting nuts over grain — right for border-control workload, not per-serving risk.
- "X rejections out of Y shipments." Neither file counts shipments, only value — a per-batch failure rate is impossible. This rate is rejections per billion dollars, a workload measure.
- Cause. RASFF records what was found, never why.
Frequently asked questions
Which country has the most EU food border rejections?
Why does China rank high on rejection counts but low on rejection rate?
What is RASFF?
Are rejected foods dangerous to people who already bought them?
Which hazard appears most often in EU food rejections?
- Rejection counts: RASFF, 800 notifications validated September 17 – November 9, 2026 (monthly spread 194 / 500 / 106; pulled 2026-11-10, paged to exhaustion); border-rejection classification = 221. The upstream date filter accepts the requested range but returns the latest matching rows, so the article states the actual validated range rather than the requested one.
- Denominator: UN Comtrade, 2024 (latest complete year), exports from each origin to Germany and the Netherlands, seven food HS chapters (03 fish, 08 nuts, 09 coffee/tea/spices, 16 prepared fish, 17 sugar, 20 processed produce, 21 misc food). DE and NL are the EU's dominant food entry ports; all origins share the same denominator construction, so the ranking is robust while absolute rates carry the two-port approximation.- Rate = rejections ÷ export value × $1B. Value weights expensive commodities over cheap ones; stated as a construction limit.
- Excluded from rate ranking: Russia (sanctions) and Vietnam (reporter gap); data-driven, detailed above.
- Hazard buckets derived from RASFF subject text (ochratoxin/aflatoxin/salmonella/pesticide names); bucketing rules are ours, not RASFF's.
The rejection counts, the export denominators and the rate per billion — all one join across the RASFF and Comtrade files. Sign up free and rerun it for your origin or commodity.
A free allowance is included at sign-up. Registering makes each rerun comparable to the last.