 Dicaria
The complaint mix broke in April 2022 and never went back
Credit-report complaints to the CFPB tripled between 2024 and 2026, and the headline reads like one long rise. The file says otherwise: in April 2022 the mix broke, and it never returned to its earlier shape.
Credit-report complaints grew hard — 124,322 in January 2024 to 693,360 in October 2026 — but the mix broke in April 2022: "improper use" jumped from 18.4% to 40.8% of the category in one month, while "incorrect information" fell from 46.7% to 33.0%. The level kept rising; the mix never returned to its old shape. So the headline number cannot be read as "more people think their file is wrong" — that share was 64.4% in January 2021, 33.0% at the break, and 59.6% now.
What the complaint file counts, and one trap inside it
The CFPB Consumer Complaint Database logs every complaint a consumer files against a financial company, with the company's response category. It is one of the few large public files where ordinary people's problems arrive labeled by the government itself.
One trap here fails silently: in the current data, credit-report complaints live under a longer product name — "Credit reporting or other personal consumer reports" — which replaced the older "Credit reporting" label. Searching the old label pulls mostly pre-2015 rows, and the windowed count then returns zero instead of an error. Every number in this article uses the label valid for its year.
With the right label, the category is enormous: 5,733,641 of 6,283,414 complaints across all products in January–October 2026 — 91.3% of everything the CFPB received is about credit reports. Credit reporting is not one complaint category among many; it is the database.
Credit-report complaints have been rising for years, and that part is well documented. The CFPB's own 2022 annual report records the category roughly doubling that year, and public-interest write-ups have covered the same ground since. So "complaints are up" is not a finding, and the honest way to use this file is to ask a sharper question: not how much, but what changed. The answer is a single month.
April 2022: the mix broke in one step
| Month | Total | Improper use | Incorrect information |
|---|---|---|---|
| 2021-12 | 31,660 | 10.2% | 49.3% |
| 2022-01 | 38,566 | 11.6% | 50.9% |
| 2022-02 | 38,138 | 12.9% | 49.2% |
| 2022-03 | 45,114 | 18.4% | 46.7% |
| 2022-04 | 55,649 | 40.8% | 33.0% |
| 2022-06 | 48,439 | 46.9% | 30.0% |
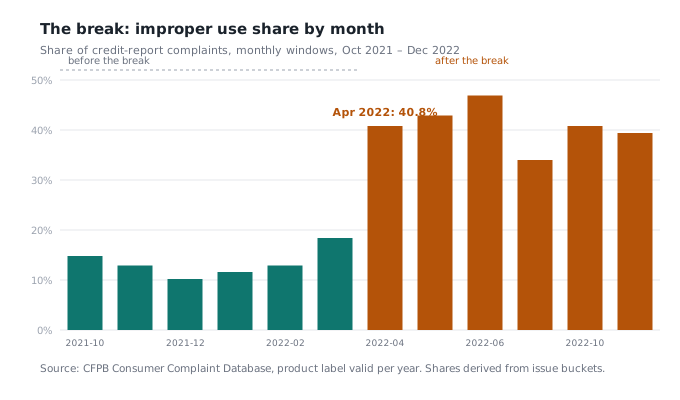
Between March and April 2022, "improper use of your report" gained 22.4 points of the category and "incorrect information on your report" lost 13.7. Not a gradual drift: one month, one step, and no warning in the three months before it.
What changed in the complaint mix is not what anyone was complaining about at the bureau. Improper use is the category for a bureau handing a report to someone who had no right to see it — a landlord, an employer, a lender pulling it for a purpose the consumer did not authorize. Incorrect information is a file with the wrong content. These are different complaints about different failures: one is about who is looking, the other about what they saw.
The mix never came back
| Year (January) | Total | Incorrect information | Improper use | Investigation |
|---|---|---|---|---|
| 2020 | 15,099 | 68.3% | 5.6% | 21.2% |
| 2021 | 28,896 | 64.4% | 5.7% | 27.5% |
| 2022 | 38,566 | 50.9% | 11.6% | 33.9% |
| 2023 | 73,392 | 36.3% | 35.8% | 26.5% |
| 2024 | 124,322 | 50.4% | 29.3% | 19.2% |
| 2025 | 373,201 | 53.0% | 24.3% | 21.8% |
| 2026 | 484,123 | 59.6% | 21.7% | 17.9% |
Improper use settled back down — to 21.7% by January 2026. Incorrect information climbed back to 59.6%. And yet the 2020–2021 shape, where improper use sat at roughly 6% of all credit-report complaints, never appears again in the file. The level rose through 2022 and kept rising afterwards. The structure changed in one step and did not go back.
This is the part a chart of annual totals hides completely. A 15,099 → 484,123 line looks like one continuous trend. The mix underneath it has a hinge in it.
Is it the whole database getting busier?
No, though it is part of it. All CFPB complaints grew from 149,189 in January 2024 to 547,500 in January 2026 — ×3.67. Credit reporting grew ×3.89 over the same pair of months. Everything else in the database grew ×2.55. Credit reporting's share of all complaints moved from 83.3% to 88.4%.
So the category did outgrow the database, but by about five points of share. Most of the rise is the database getting busier; credit reporting's own growth is a bit faster than that tide, and the part that is genuinely about credit reporting is the mix change above, not the level.
Is one bureau behind this?
No. At the April 2022 break the top two named companies were Equifax (16,926) and TransUnion (16,909) — effectively tied, and Experian in the same range. Across the whole curve the three move together, month after month, including the break. Whatever drove it was not one firm's behaviour.
Which also means the complaint file cannot tell you which bureau has more errors. A company's line is a measure of who consumers chose to complain about, and the three are near-identical in share (94%+ of the category between them in any 2026 month), so the ordering between them is a difference in volume, not in quality.
To see where the break falls in your own window, rerun the mix series yourself — a window that starts in 2024 misses it entirely.
The file has no cause fields, so the honest position is: the mix broke, the timing is visible, the mechanism is not in the data. There is public context that fits the timing — during the pandemic the three bureaus offered free weekly credit reports by agreement, and that arrangement was allowed to lapse, so consumers checking their file weekly for free would find errors they never saw before. A step change in "someone saw my report and should not have" is consistent with an access story. That is context, not a finding from this file.
What the file does support is the shape, and the shape has a practical consequence: "credit-report complaints" stopped being one thing after April 2022. Any series that starts in 2024 — including most published charts — measures the post-break world and reports it as the whole story.
Are bureaus slow-walking complaints? No — 99.9% timely
The CFPB records how companies close complaints. For January 2026 credit-report complaints: 61.7% closed with an explanation, 38.2% with non-monetary relief (a correction on the file), 0.02% with monetary relief (107 of 484,123). Responses were on time 99.9% of the time.
Whatever the surge means, it is not collapsing processing. It is the cost side of a complaint system running at thirty times its 2020 traffic, and answering on time.
What this file cannot answer
- Why the mix broke in April 2022. No cause fields; awareness and access changes are equally consistent with the shape.
- Whether files actually got worse. Complaints are allegations; "closed with explanation" records neither verdict nor consumer satisfaction.
- Which bureau has more errors. The three are near-identical in share and move together, so the file ranks volume, not quality.
- Per-person rates. No population or file-count denominator lives in this file.
- Identity theft depth. Fraud-alert complaints exist but the category has no loss fields, and fraud/identity issues are 0.5% of the category — too small to explain the shape.
Frequently asked questions
How do I complain about wrong information on my credit report?
Which credit bureau has the most complaints?
Did credit report complaints increase in 2026?
Has the mix of credit-report complaints changed?
Does a complaint hurt my credit score?
- Data pull: 2026-11-06 (agentdata SDK).
- Source: CFPB Consumer Complaint Database via the agentdata SDK, retrieved 2026-11-06, product label "Credit reporting or other personal consumer reports" with date-windowed aggregations.
- Product label changes in 2024. The category was "Credit reporting, credit repair services, or other personal consumer reports" before 2024 and dropped "credit repair services" afterwards; no standalone credit-repair label exists in the file. Each year in the tables uses the label valid for that year.
- The old short label "Credit reporting" returns pre-2015 rows and a windowed count of zero — documented in the facts file.
- Monthly totals use [first-of-month, first-of-next-month) windows. Because the API's upper bound behaves inclusive, monthly sums slightly exceed the clean Jan 1 – Nov 1 window total (5,834,948 vs 5,733,641 — first-of-month overlaps); the window aggregate is used for totals, monthly rows for shape.
- Mix percentages are derived from the issue buckets of the same windows.
- January-to-January anchors: 2020-01-01→02-01 through 2026-01-01→02-01, identical method each year. January 2026 totals differ by 1 across two pull batches (484,122 vs 484,123 — upstream rows shift between pulls); 484,123 is the value verified by two independent calls and is used throughout.
- The bureau shares above are registry values (the bureaus are the category at 94%+); no other company is named.
The mix series back to 2020, the all-product totals that separate a rising database from a worsening one, and the three bureau lines: all one aggregation query on the CFPB file. Sign up free and rerun it — a window that starts in 2024 will miss the 2022 step entirely.
A free allowance is included at sign-up. Registering makes each rerun comparable to the last.